
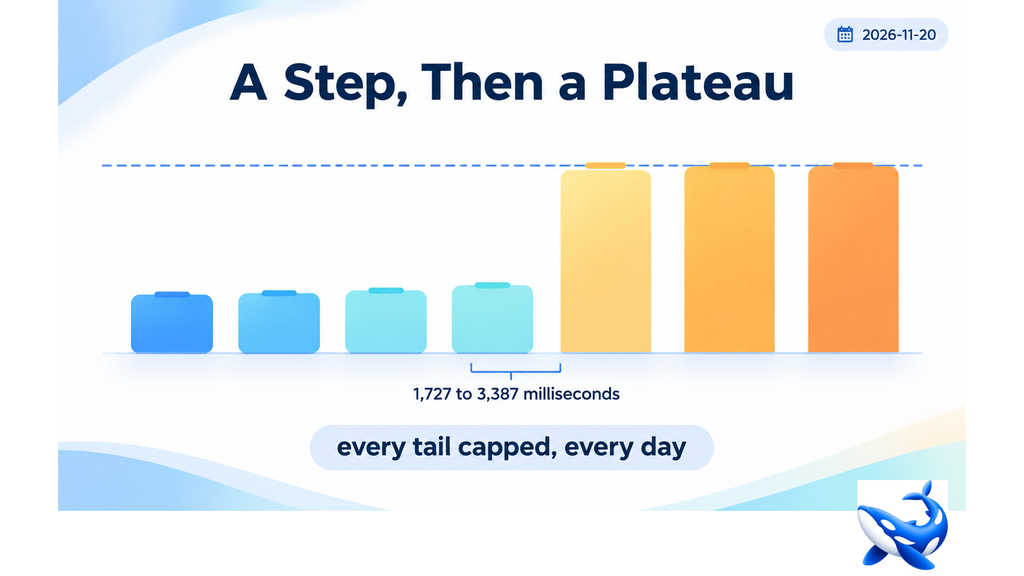
Fifteen hundred ninety-four milliseconds is how much this card’s daily median rose between the 18th and the 19th, and it never came back down. OrcaRouter reports the seven daily figures. They sit on OrcaCyber Zero 1.0 latency, and the last three days describe a card that is now materially slower than it was on Monday.
The seven days
| date | p50 ms | p95 ms |
| 2026-11-14 | 1,485 | 10,000 |
| 2026-11-15 | 1,675 | 10,000 |
| 2026-11-16 | 1,233 | 10,000 |
| 2026-11-17 | 1,789 | 10,000 |
| 2026-11-18 | 1,727 | 10,000 |
| 2026-11-19 | 3,387 | 10,000 |
| 2026-11-20 | 3,797 | 10,000 |
Four days between 1,233 and 1,789, one at 1,727, then a step to 3,387 and 3,797. The weekly figure of 1,883 describes the first five days and misrepresents the last two.
The spread of 3.08× is the third-widest in the tier and the widest among cards whose median stays under four seconds. The step is 1.96× in a single day.
This is the clearest step change in the tier. Ultra 1.0 rose 2.2× over five days; this card rose 1.96× overnight and held the new level for two days, which is a different shape — one discontinuity rather than a drift.
A one-day step that persists is more consistent with a serving change than with load. Traffic load usually produces a hump; a deployment or capacity event produces a floor.


Seven capped tails and no readable one
Every p95 in the week reads exactly 10,000 ms. That is the reporting cap, so no day gives a usable tail figure.
| card | p50 spread | capped days | readable tails |
| Hy4 | 1.09× | 3 | 4 |
| MiniMax M3.1 Flash | 1.20× | 1 | 6 |
| Hy4 Flash | 1.33× | 1 | 2 |
| GLM 5.3 Flash | 1.34× | 7 | 0 |
| GLM 5.3 | 1.41× | 1 | 6 |
| Flash 1.0 | 1.57× | 0 | 7 |
| K3.1 Pro | 1.83× | 2 | 5 |
| Zero 1.5 | 2.26× | 4 | 3 |
| MiMo V2.6 Flash | 2.53× | 6 | 1 |
| Zero 1.0 | 3.08× | 7 | 0 |
| Ultra 1.0 | 3.37× | 6 | 1 |
Two cards have no readable tail on any day, and this one is the worse of the two because its median also moves. A buyer gets instability in both columns and a published tail that is a constant.
The practical consequence is that this card cannot be timeout-planned from its own published data. A 10-second limit is a guess that the tail stops at the cap; a 30-second limit is a guess the other way. With Ultra 1.0 at least one day gives a number.
That is a stronger statement than “the tail is bad”. A bad tail can be measured and budgeted for. A censored tail on every day cannot be measured at all.
The card’s shape under the new level
At the current 3,797 ms the card has become a different product from the one its weekly figure describes.
| quantity | first five days | last two days |
| median p50 | 1,582 ms | 3,592 ms |
| throughput | 240.2 tok/s | 240.2 tok/s |
| implied median answer | 380 tokens | 863 tokens |
The last row is our arithmetic — the median divided by the weekly rate — and it suggests something different from a slow card. If throughput is unchanged at 240.2 tokens a second, a median that rose 2.27× implies the typical response also got 2.27× longer.
That reading is plausible and unverifiable from the published fields. A workload shift toward longer answers would produce exactly this pattern in both columns, and it would be a fact about the traffic rather than about the card.
The alternative reading is that first-token latency genuinely rose, in which case the implied answer length is an artefact of multiplying a first-token figure by a generation rate. Both are consistent with the data.
What a buyer can rely on is narrower than either: the card’s median in the current week was more than twice its median in the previous five days, and the reason is unpublished.
What to do with a card in this state
Three practical moves, in order of how much they depend on interpretation.
Quote the current level, dated. A weekly figure blends 1,582 and 3,592 and describes neither. Any capacity plan built on 1,883 will be wrong by a factor of two within days.
Do not derive a timeout from this card. Seven capped days means no usable tail. Set a timeout from the workload’s own tolerance and measure the exceedance yourself.
Re-measure before committing. A step that persists two days may persist for a week or reverse. The published fields give no forward signal, and the card’s own prior week was the faster regime.
Those three moves are all the published data supports. The fourth thing a buyer might want — an explanation — is not in the fields, and this article does not invent one.
The 3.08× spread and the seven-cap week are both visible on the card. Neither requires inference, and together they are the strongest argument for re-measuring rather than quoting.
What a nineteen-hour wait looks like across the week
If the median rose overnight and held, the card’s behaviour after the 18th differs from its behaviour before, and the two can be described separately.
| window | days | median p50 | median p95 | implied answer |
| 11-14 to 11-18 | 5 | 1,582 ms | 10,000 | 380 tokens |
| 11-19 to 11-20 | 2 | 3,592 ms | 10,000 | 863 tokens |
The tail column is identical in both rows because it is capped on every day. The median column differs by a factor of 2.27.
That two-regime split is our arithmetic on the published series and it is the most defensible description available. The weekly figure of 1,883 is a weighted average of 1,582 and 3,592, and it is the median of neither population.
The implied-answer column is the weakest part of the table. It multiplies a first-token median by a weekly generation rate, which assumes the rate is constant across both regimes — and the published fields give no daily rate to check that.
So the split in the first two columns is solid and the third is a hypothesis. A buyer can act on the first two: a card at 3,592 ms behaves differently from one at 1,582, and the last two days are the current evidence.
One last field is worth adding because it is often assumed to move with latency. The error rate of 0.09% is the joint-lowest in the tier and it is published as a weekly figure, so there is no way to tell whether it changed when the median stepped. A card that got slower without getting less reliable is a different situation from one that got slower because it started failing, and the published fields separate neither.
OrcaCyber Zero 1.0’s daily median rose 1.96× overnight from 1,727 to 3,387 milliseconds and held at 3,797 the following day, giving a 3.08× weekly spread that blends two distinct regimes.
Every one of its seven p95 readings is the 10,000 ms cap, making it one of two cards in the tier with no readable tail at all, so no timeout can be derived from published data. The card’s throughput is unchanged at 240.2 tokens a second, which leaves the step’s cause unpublished.
Sourcing note: the seven-day daily p50 and p95 series, weekly percentiles, throughput, error rate, price rows and ceiling are read from the OrcaCyber Zero 1.0 model API and card page on orcarouter.ai on 2026-11-20, with latency and throughput being OrcaRouter production telemetry for 2026-11-14 to 2026-11-20. The spreads, two-regime averages and implied answer lengths are our own arithmetic; the readings offered for the step are labelled as inference. A p95 reading of exactly 10,000 ms is the reporting cap, not a measurement. OrcaCyber Zero 1.0 is a post-trained model. No competitor product is named or compared. Checked 2026-11-20.